I will explain what I used to do my project.
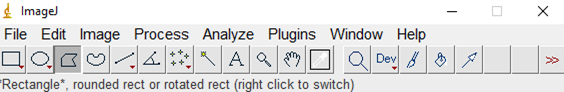
- Image J: program I used to calculate the areas of the peaks.
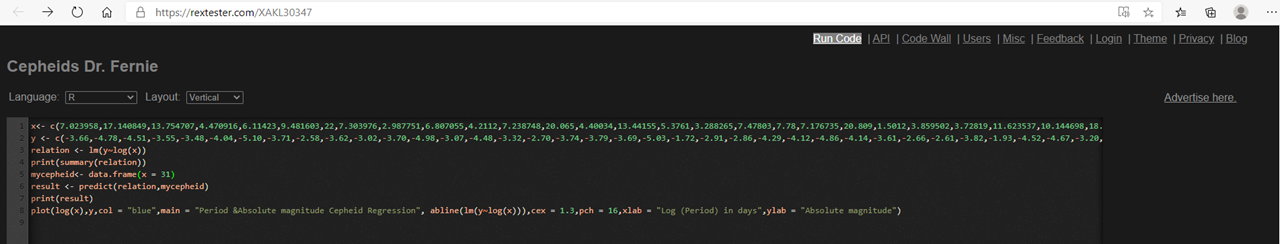
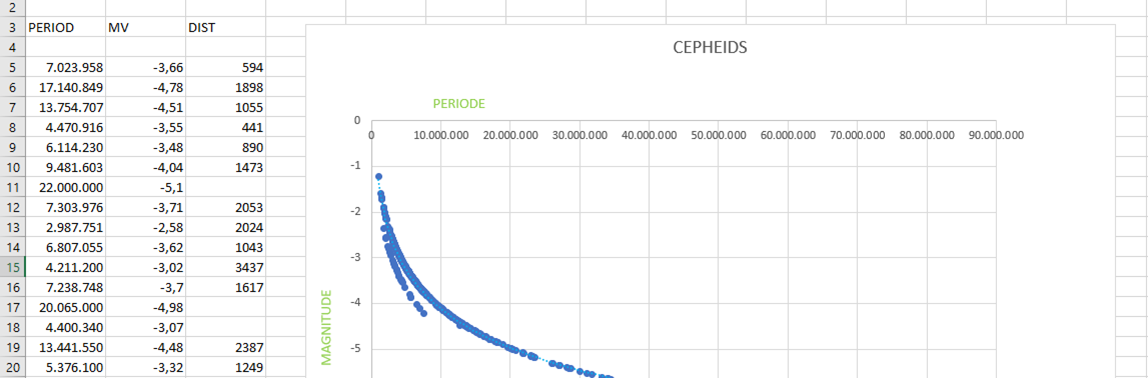
- Rextester: program that I have used to obtain a graph of the Cepheids.
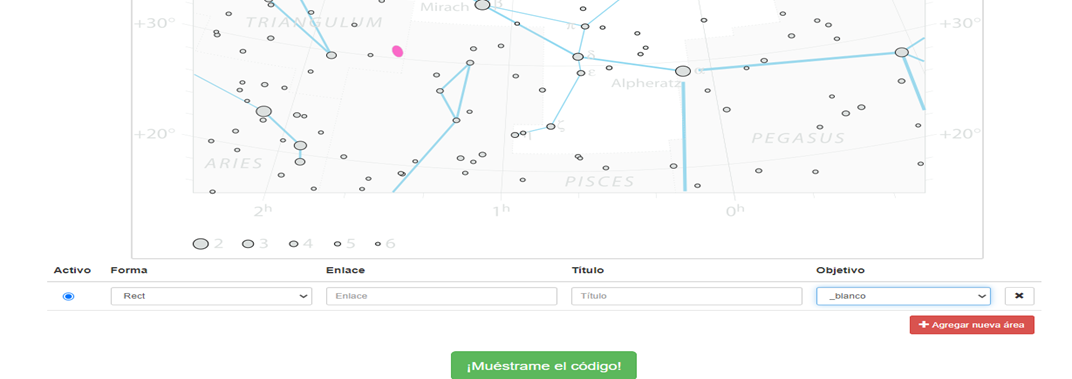
- Image map: an image map is a list of coordinates related to a specific image of the supernova , created to hyperlink circular areas of clouds to the image.
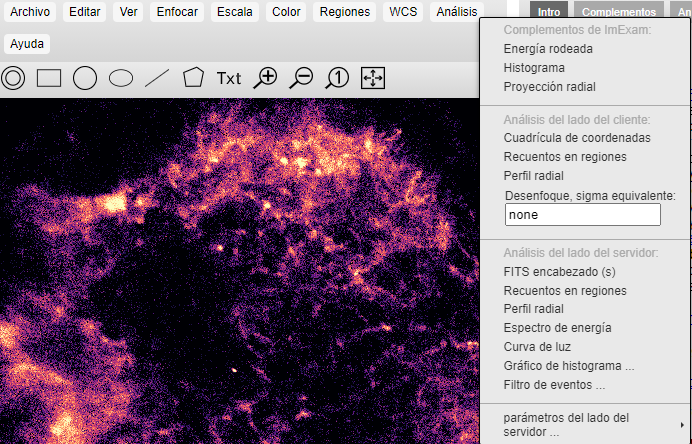
- JS9: software that I have used to analyze and obtain the graphs of the different objects in the sky.
- Excel: Spreadsheet that I have used to put data in the Cepheids and where I have obtained a graph and a formula
- Google Scholar: search engine I have used to search for documents and articles by other scientists in order to compare my results with those of other scientists.

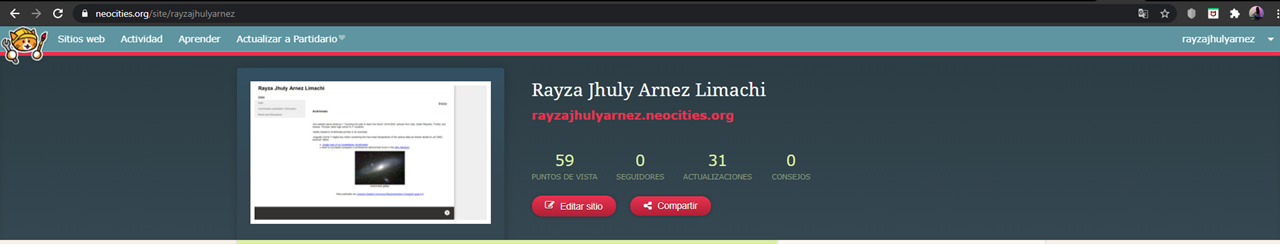
- Neocities: web hosting service that I have used to upload my website.
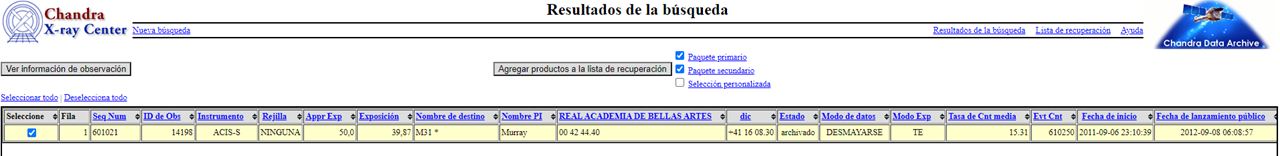
- Chandra: To find the graph with the energy spectrum, I had to search this database.
- The Sky Live: website where I found the image of the constellation Andromedae.
- ezyZip: zip file format that I have used to compress files.
- Exoplanet Lab: lab where I took a picture with an arizona telescope of an object in the sky.
- NASA Exoplanet Archive: I have used this website to search for information about exoplanet SN1885A
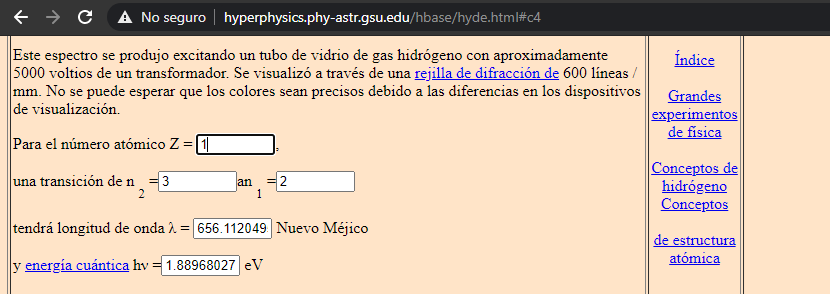
- Hydrogen energies and spectrum: I have used this website to search the energies of the different elements.